

AI Enablement
How to Measure ROI from Business Enablement Systems
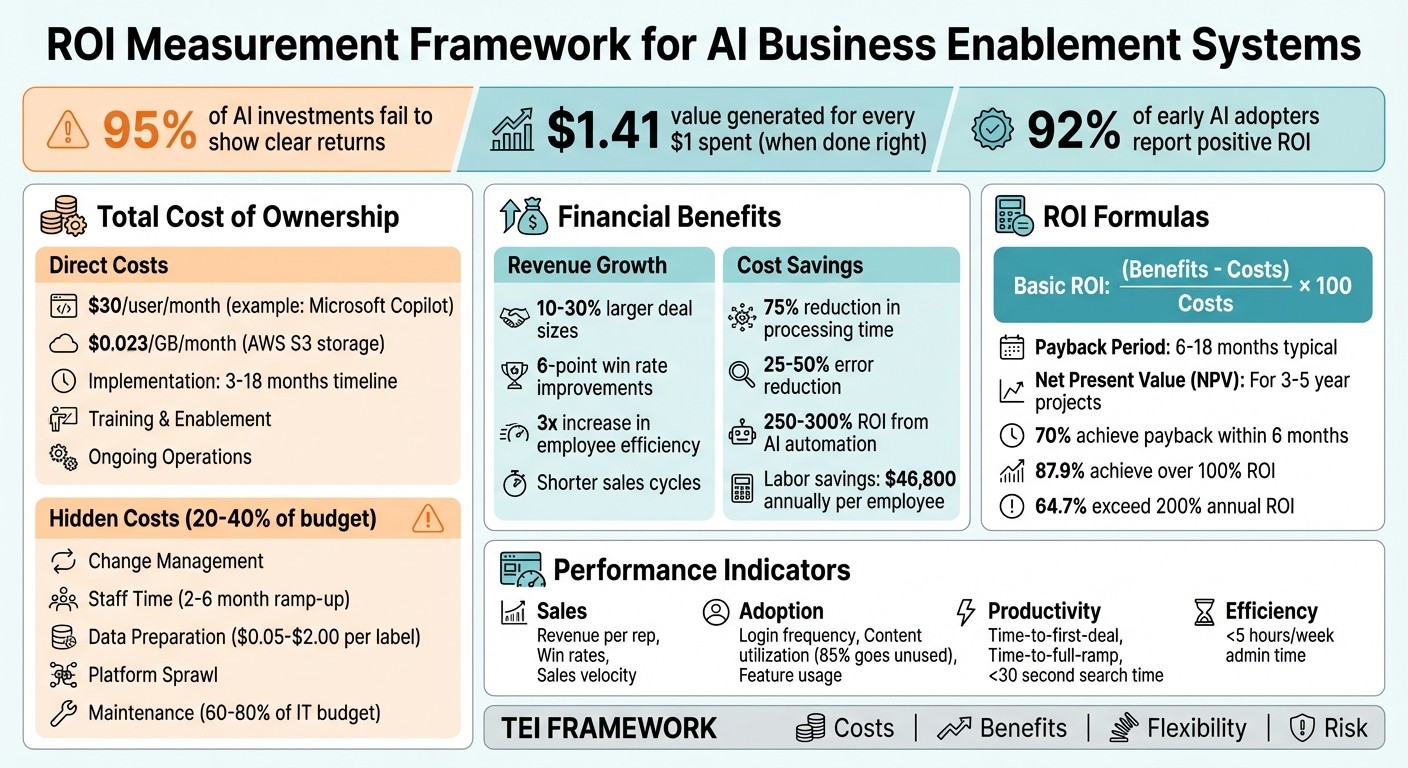
Measuring ROI for AI-driven business systems is critical, especially as 95% of AI investments fail to show clear returns. The key challenge? Organizations often struggle to link technical improvements to financial outcomes. Yet, companies that get it right can generate $1.41 in value for every $1 spent.
Here’s what you need to know:
Costs: Factor in all expenses, including software, infrastructure, training, and hidden costs like change management and staff time.
Benefits: Focus on revenue growth (e.g., larger deal sizes, faster sales cycles) and cost savings (e.g., labor reduction, error prevention).
Frameworks: Use models like Forrester’s Total Economic Impact (TEI) to evaluate costs, benefits, flexibility, and risks.
Metrics: Track adoption rates, revenue per employee, win rates, and efficiency gains to measure success.
Methods: Calculate ROI using basic formulas, payback periods, and Net Present Value (NPV) for long-term projects.
With structured measurement and continuous tracking, businesses can ensure their AI investments deliver measurable financial returns.
ROI Measurement Framework for AI Business Enablement Systems
ROI Basics for Enablement Systems
What ROI Means for Enablement Systems
ROI, or return on investment, measures whether an investment delivers measurable financial benefits. For AI-driven enablement systems, this translates into cost savings, revenue growth, and reduced risks.
Traditional ROI formulas often fall short when applied to AI systems because they miss harder-to-quantify benefits. With AI, operational improvements need to be expressed in financial terms to truly capture their impact. This is what sets AI ROI calculations apart from those for conventional technologies.
For example, efficiency gains only translate into real ROI if the saved time is spent on high-value activities. If automation frees up 10 hours per week but that time is used for low-priority tasks, the ROI will appear inflated. The true value comes when that time is redirected toward impactful efforts, like increasing proposal output, resolving more customer issues, or closing additional sales.
Frameworks like TEI (Total Economic Impact) help address these complexities by providing a more detailed look at investment value.
The Total Economic Impact (TEI) Framework
For over two decades, Forrester's Total Economic Impact (TEI) framework has been a trusted method for evaluating investments. Unlike basic ROI calculations, TEI considers a broader range of factors, breaking them into four key categories:
Costs: This includes expenses like licensing fees, GPU hours, data labeling, and training.
Benefits: These cover direct advantages (such as labour savings and fewer errors) and indirect gains (like faster processes and increased revenue).
Flexibility: This measures the strategic opportunities your system enables, such as scaling to new use cases without needing more staff.
Risk: Adjustments are made for uncertainties like model drift, data quality challenges, and regulatory changes.
"TEI provides a rigorous analysis methodology that incorporates costs, benefits, future technology and business strategy, business flexibility, and associated risks." - Sean Owens, Jon Erickson, Forrester
The flexibility aspect is especially important for enablement systems. It captures the "options value", or the potential of your AI investment to adapt to future business needs. For instance, an AI system that can scale across departments or pivot to support new strategies adds long-term economic value - even if that value isn’t immediately measurable. This makes TEI a powerful tool for justifying both immediate returns and strategic investments.
Understanding these ROI fundamentals sets the stage for diving into more precise calculation methods later in this guide.
How to Measure AI ROI (Before You Spend Another Dollar)
Calculating Enablement System Costs
To accurately measure ROI, it’s crucial to fully grasp the costs associated with your enablement system. Many businesses fall into the trap of underestimating their expenses by focusing solely on obvious costs - like software licenses - while ignoring less visible ones. These hidden costs can account for 20% to 40% of the total project budget.
A thorough Total Cost of Ownership (TCO) analysis includes both direct costs (clearly billed expenses) and indirect costs (resources consumed but not explicitly invoiced). Neglecting either can lead to flawed ROI calculations, poor investment choices, and unrealistic expectations.
Direct Cost Components
Direct costs are the ones you’ll see on invoices and budget line items. At the core are software and licensing fees, which include per-user subscriptions and API usage fees. For instance, Microsoft Copilot for Microsoft 365 costs about $30.00 per user per month. If your system relies on AI tools with API access, you’ll also incur usage fees based on the number of tokens processed - both input and output.
Infrastructure and hosting expenses cover the technical foundation of your system. These include cloud compute costs (like GPU hours), data storage (AWS S3 charges around $0.023 per GB per month in the us-east-1 region), vector databases, and hosting environments. As your system scales to handle more data and users, these costs grow proportionally.
Implementation and integration costs are often substantial one-time investments. These include setup, customisation, data integration, and consulting, which can take anywhere from 3–6 months for straightforward solutions to 9–18 months for more complex systems. Then there are training and enablement expenses, such as workshops, creating learning materials, and holding training sessions to upskill staff. Finally, ongoing operational costs include model monitoring, retraining, security audits, and technical support - expenses that recur on a monthly or quarterly basis.
Cost Category | Component Examples | Frequency |
|---|---|---|
Software | Licenses, API tokens, seat-based subscriptions | Recurring |
Infrastructure | GPU hours, hosting, vector DB, storage | Recurring |
Implementation | Integration, data prep, third-party consulting | One-time |
Training | Workshops, content creation, certification | Mixed |
Hidden and Indirect Costs
Some of the most impactful expenses don’t appear on invoices. Change management is a perfect example, often accounting for 20% to 40% of the total project budget. These costs include the time spent adjusting processes, overcoming resistance, and ensuring system adoption across the organization.
"Change-management expenses can equal 20–40% of project budgets." - Erin Moore, Author, AutomateNexus
Another major hidden cost is staff time. Employees will dedicate hours to scoping requirements, cleaning data, attending training sessions, and adapting workflows. During the initial 2 to 6 month ramp-up period, productivity often dips before improvements kick in. Additionally, many organizations deal with platform sprawl, managing duplicate systems and performing manual audits to eliminate redundancies.
For AI-driven systems, data preparation is a significant expense. Data labeling alone can cost between $0.05 and $2.00 per label, and deep learning models may require tens of thousands - or even hundreds of thousands - of labeled examples. Add to this the cost of data cleansing, quality checks, and ongoing maintenance, and the total becomes substantial. On average, organizations spend 60% to 80% of their IT budgets maintaining existing systems, leaving only 20% to 30% for innovation.
To create an accurate TCO model, it’s important to amortize one-time costs over a set period (e.g., 24 months) to understand their monthly impact. You should also apply a risk premium of about 3% over your Weighted Average Cost of Capital to account for uncertainties specific to AI. Finally, update your pricing assumptions monthly, as API and model costs can change frequently, skewing projections. This detailed breakdown of costs forms the foundation for assessing the ROI of AI-driven systems.
Quantifying Financial Benefits
Once you've mapped out your costs, the next step is to measure the financial returns your enablement system generates. These returns generally fall into two categories: revenue growth and cost savings. Both are essential for understanding your ROI and require structured tracking to ensure you're capturing genuine gains, not just assumptions.
Many organizations struggle to pinpoint the exact impact of their digital initiatives. The challenge isn't the lack of value but the discipline required to measure it. You'll need stable baselines, clear attribution methods, and a plan for reallocating saved time effectively.
Revenue Growth Opportunities
Enablement systems can boost revenue in three key ways: shorter sales cycles, larger deal sizes, and higher conversion rates. To measure this, track these metrics before and after implementation, using controlled rollouts or A/B testing to isolate the system's impact.
Larger deal sizes are one of the easiest metrics to observe. For example, AI integrated into customer experience and ERP systems can increase deal sizes by 10% to 30%. Imagine a $50,000.00 deal growing to $60,000.00 - that's a clear $10,000.00 increase per transaction, driven by AI identifying upsell or cross-sell opportunities that sales reps might miss.
Win rates also improve with AI insights. If your pre-implementation win rate is 22% and climbs to 28% after adoption, that 6-point jump directly translates into more closed deals. Multiply that improvement by your pipeline volume, and you'll see the revenue impact.
Shorter sales cycles allow your team to handle more deals without adding headcount. For instance, if your team closes 40 deals per quarter with a 90-day cycle, and AI reduces that cycle, each rep can manage more opportunities. In September 2025, Nestlé implemented AI tools within SAP Concur, achieving a 3x increase in employee efficiency for report creation. Gains like these compound over time.
To calculate total revenue uplift, multiply your baseline revenue by the percentage improvement and adjust for actual adoption rates. If only 60% of your team uses the system, a projected $2M gain becomes $1.2M. It's worth noting that 92% of early AI adopters report positive ROI, with many seeing $1.41 in value for every $1.00 spent.
"AI isn't magic. It only delivers ROI when it's properly configured, adopted, embedded into workflows, and tied to measurable outcomes." – Bryan Bayless, VP, Revenue Center of Excellence, Gong
While revenue growth highlights top-line benefits, operational efficiencies focus on cost reductions.
Cost Savings and Efficiency Improvements
In addition to boosting revenue, enablement systems can significantly cut costs through labor automation, error reduction, and process acceleration. These savings are often easier to quantify, as they rely on measurable inputs like hours, wages, and error rates.
Labor savings are calculated by multiplying hours saved by your fully loaded labor cost (salary, benefits, and overhead). For instance, if automation saves 20 hours per week of manual data entry at $45.00 per hour, that's $900.00 weekly or about $46,800.00 annually per employee. In September 2025, Chobani used AI to streamline financial operations, reducing expense processing time by 75%. This freed up finance teams to focus on strategic analysis rather than routine tasks. However, these savings only count if the freed time is redirected to high-value activities like more sales calls or faster customer responses.
Error reduction is another area where AI shines, cutting costs tied to rework, refunds, and compliance penalties. Automation can reduce error rates by 25% to 50%. For example, in 2025, Pinnacle Financial automated 50,000 monthly invoices, dropping the error rate from 8% to 0.5%. The cost per invoice fell from $15.00 to $3.00, leading to annual savings of $7.2M and a payback period of under six weeks.
Throughput improvements enable higher volumes without adding staff. In 2025, Meridian Health processed 200,000 claims monthly after investing $3M in AI automation. Processing time dropped from 12 days to 2 days, and the cost per claim fell from $8.00 to $2.50, generating $13.2M in annual savings and a 340% first-year ROI.
Benefit Type | Metric | Calculation |
|---|---|---|
Revenue Growth | Average Deal Size | (New Deal Size - Baseline) × Closed Deals |
Revenue Growth | Win Rate Lift | (New Win % - Baseline %) × Pipeline Volume |
Cost Savings | Labor Reduction | Hours Saved × Fully Loaded Hourly Rate |
Cost Savings | Error Avoidance | (Baseline Errors - New Errors) × Cost per Error |
Efficiency | Cycle Time | (Baseline Days - New Days) × Daily Operating Cost |
AI-powered automation delivers 250% to 300% ROI, far outpacing the 10% to 20% returns seen with older RPA systems from 2015–2020. Modern systems can handle unstructured data, adapt to changes, and make decisions rather than simply following scripts. Additionally, payback periods have shrunk from 12–18 months to as little as six weeks for mid-sized deployments.
Performance Metrics for ROI Assessment
After identifying the financial benefits of your AI-driven strategy, performance metrics become essential. These metrics act as proof points, connecting your enablement system to business outcomes. Without them, you're essentially making decisions without a compass.
Metrics typically fall into three main categories: sales and revenue indicators that directly affect your bottom line, adoption and engagement data that measure how well your team is using the system, and onboarding and productivity measures that track how quickly new hires start contributing to revenue.
Sales and Revenue Metrics
Sales metrics are the backbone of your enablement system's impact on revenue. Key indicators include revenue per representative, quota attainment, win rates, and sales velocity. Each one provides a clear link to financial results.
Take revenue per representative as an example. If the average rep previously brought in $500,000 annually but now generates $625,000 after the system's implementation, that's a $125,000 increase per person. Multiply that by your entire team, and the financial impact becomes impossible to ignore.
Win rates are another critical metric. By comparing Closed-Won deals to Closed-Lost or No Decision outcomes, you can gauge the system's effectiveness. A jump from a 22% win rate to 28% directly translates into more closed deals and increased revenue. To ensure accuracy, review data from at least one full sales cycle.
Sales velocity offers a comprehensive view by factoring in opportunities, deal size, win rates, and cycle length. If your system shortens sales cycles while boosting win rates, your pipeline efficiency - and revenue flow - improves significantly.
"In the world of evaluation and attribution, we must often agree to accept logical and reasonable evidence, versus cold, hard proof." – Mike Kunkle, VP of Sales Effectiveness Services, SPARXiQ
Working closely with your finance team ensures that your ROI analysis aligns with corporate standards. While sales metrics showcase revenue impact, adoption and engagement data reveal whether the system is delivering its intended value.
Adoption and Engagement Metrics
Adoption metrics serve as leading indicators, giving you an early sense of whether your system will deliver ROI. If the platform isn't being used, it's a wasted investment.
Start with leadership engagement. Track how often executives log in and if they reference enablement data during pipeline reviews. Surprisingly, 75% of sales leaders log in fewer than five times per quarter, and 16% never log in at all. Without leadership buy-in, adoption across the team will falter.
"If nobody is using it, you are either wasting your money or have done a poor job with rollout and training and need a reboot." – CMO, Brand Management Company
Next, examine content utilization. Are reps actually using the materials provided? Currently, 85% of leaders report that at least 40% of customer-facing content never reaches buyers, and 24% say over 80% of their content goes unused. This represents a huge inefficiency.
Feature adoption rates help identify underused functionalities. Nearly 80% of enablement leaders report that reps ignore at least 40% of their platform's features. Paying for unused capabilities drains resources.
Consider the case of Abbott Laboratories in 2021. Before implementing a new platform, less than 1% of sellers accessed training voluntarily. After the change, engagement skyrocketed to 900 users generating over 200,000 views in just 180 days. This kind of turnaround highlights the importance of adoption.
Finally, content freshness is crucial. Nearly 49% of leaders admit that 40% to 100% of their content is outdated. Reps lose trust in the system when materials feel stale, so it's essential to track and update high-usage content regularly.
Onboarding and Productivity Metrics
Onboarding metrics measure how quickly new hires contribute to revenue. Faster ramp times mean quicker returns on your investment in hiring and training.
Key indicators include time-to-first-deal and time-to-full-ramp. For example, reducing ramp time from six months to four months allows new reps to start generating revenue two months earlier. Across a growing team, this can lead to substantial gains.
Time-to-answer is another important metric. Ideally, reps should find the content they need in under 30 seconds. If they’re wasting time searching through multiple systems like Slack, Google Drive, or a CRM, productivity takes a hit. The best systems integrate seamlessly with existing tools.
A real-world example comes from Clarabridge, which saved $800,000 in 2021 by shifting onboarding from in-person sessions to virtual training. This demonstrates how onboarding efficiency can reduce costs while maintaining quality.
Lastly, keep an eye on the administrative burden placed on enablement managers. Ideally, they should spend less than five hours per week managing the platform. If they're spending more time troubleshooting than enabling sellers, something needs to change.
Category | Core Metrics | Business Outcome Link |
|---|---|---|
Sales Performance | Win rate, Quota attainment, Revenue per rep | Direct Revenue Growth |
Adoption | Login frequency, Content shares, Feature usage | System ROI & Tool Consolidation |
Productivity | Time-to-full-ramp, Time-to-first-deal | Reduced Cost of Sales / Faster ROI |
Efficiency | Search time (<30s), Admin hours (<5h/wk) | Operational Expense (OPEX) Reduction |
Pipeline | Stage conversion rates, Sales cycle length | Improved Sales Velocity |
With 84% of reps achieving quotas when a strong enablement strategy is in place, tracking the right metrics is crucial. These measurements ensure that every dollar spent on your system translates into tangible business and revenue gains, reinforcing the value of your AI-driven investments.
ROI Calculation Methods
When it comes to assessing the value of your enablement system, there are several ways to calculate ROI. The method you choose will depend on what your finance team prioritizes - whether they need a quick overview, a timeline for recouping costs, or a detailed long-term evaluation.
Basic ROI Formula
This is the simplest way to measure return: (Total Benefits - Total Costs) / Total Costs. It gives you a percentage that reflects how much return you’re getting for every dollar spent. For example, if your enablement system costs $200,000.00 annually (including licensing, integration, and training) and brings in $350,000.00 in combined labor savings and revenue growth, here’s how it works: ($350,000.00 - $200,000.00) / $200,000.00 = 0.75, or 75% ROI.
To get accurate results, make sure you include all costs in your total cost of ownership (TCO). This means factoring in software, data preparation, change management, cloud fees, and model retraining. On the benefits side, be as specific as possible: measure labor hours saved, error reduction, and revenue increases. Be sure to track both hard savings (actual cost reductions) and soft savings (redeployed capacity).
"Enthusiasm alone won't pay the bills." – Morne Wiggins, Agility at Scale
Once you’ve calculated ROI, the next step is to determine how quickly your investment starts paying off using the payback period formula.
Payback Period Calculation
The payback period focuses on how quickly your investment turns into positive cash flow. It answers the question: "When does this stop being a drain on resources?". Finance teams appreciate this metric because it highlights liquidity and timing risks. To calculate it, divide your total upfront investment by the periodic net benefit. For instance, if you invest $240,000.00 and generate $20,000.00 in monthly savings, your payback period is 12 months.
Track cumulative cash flow, starting with your initial investment as a negative figure. Then, add each month’s net benefit until you break even. For AI and automation projects, typical payback periods range from 6 to 18 months.
"Finance prefers payback because: It reflects liquidity reality; It exposes timing risk; It is harder to game." – A Faster Exit
Finance teams often favour payback calculations based on hard cost reductions rather than theoretical savings, as these represent actual changes in cash flow.
For investments that span several years, the Net Present Value (NPV) method provides a more comprehensive picture.
Net Present Value (NPV) for Long-Term Benefits
When evaluating multi-year projects, Net Present Value (NPV) is the go-to metric. Unlike basic ROI, NPV considers the time value of money by discounting future cash flows to their present-day value. This method is especially useful for CFOs, as it shows whether the returns outweigh the cost of capital.
To calculate NPV, estimate incremental cash flows over 3–5 years and apply a discount rate. Use your company’s Weighted Average Cost of Capital (WACC) and add a 3%–5% risk premium to account for uncertainties like model drift or adoption hurdles. For example, if your WACC is 10% and you add a 3% risk premium, your discount rate will be 13%.
Excel’s XNPV function can help you account for specific cash flow dates. Run multiple scenarios - Conservative, Expected, and Upside - to account for varying adoption rates and cost assumptions. A project is considered viable if NPV exceeds 0, meaning it generates value after covering the cost of capital.
"Lead with NPV when talking about creating value. It's the clearest measure of value created after the cost of capital, and the exact information CFOs use to green-light projects." – You.com Team
Method | Formula | Best Use Case |
|---|---|---|
Basic ROI | (Net Benefits / Total Investment) x 100 | Quick assessment of short-term projects |
Payback Period | Total Investment / Annual Net Benefit | Assessing liquidity and time-to-value |
NPV | Σ [Net Cash Flow / (1 + i)^t] - Initial Investment | Long-term, multi-year strategic investments |
Benchmarking and Validating Results
Once you've calculated ROI, the next step is to measure those figures against actual performance. This involves comparing your results with industry benchmarks and real-world case studies. Why? Because these tools help answer a critical question: "Are our expectations grounded in reality, or are we overlooking something?"
Industry ROI Benchmarks
Industry benchmarks are like a litmus test for your enablement system - offering a way to check if your performance aligns with what’s typical. For instance, Nucleus Research reports that 87.9% of technology implementations between 2021 and 2025 achieved over 100% ROI, with 64.7% exceeding 200% annual ROI. Even more impressively, 70% of these initiatives reached full payback within six months.
"Triple-digit returns and rapid value realization emerge as baseline outcomes rather than exceptions." – Nucleus Research
Different industries, however, see varying results. Here’s how some sectors stack up:
Manufacturing: Automation and predictive maintenance typically deliver 20–40% throughput improvements.
Finance: Processes like KYC and loan approvals can see up to a 70% reduction in processing time.
Customer Experience: ROI from implementations averages 214% over five years, with potential peaks of 761% when fully optimized.
Sales and E-commerce: AI-driven workflows often lead to 10–30% increases in average deal sizes.
Your organization’s maturity also plays a role. According to the IBM Institute for Business Value, the average enterprise ROI is 5.9%, but top performers hit 13%, more than doubling the average. This gap underscores how execution quality and adoption strategies can make or break your results.
While benchmarks provide a strong foundation, real-world case studies add depth and credibility to your validation process.
Using Case Studies for Validation
Case studies bridge the gap between theory and practice, offering concrete examples of what’s possible while highlighting hidden costs. For example, Microsoft tackled inefficiencies in supply chain management, cutting manual planning by 50% and improving on-time planning by 75%.
When using case studies, consistency is key. Start by establishing a 12-month pre-deployment baseline to ensure accurate comparisons. Don’t overlook the Total Cost of Ownership - account for factors like data labeling, model retraining, and change management. And make sure metrics are measured uniformly across teams to avoid inflated results.
"73% of organizations say they struggle to define their digital initiatives' exact impact or metrics, highlighting ROI as a key factor in scaling enterprise automation." – Deloitte
Case studies also allow you to create tiered ROI projections. Break them into three categories:
Conservative: 10–15% gains
Realistic: 20–25% gains
Aggressive: 30–40% gains
This layered approach accounts for differences in adoption rates and performance, giving you a clearer picture of what’s achievable under varying conditions.
Continuous ROI Monitoring Systems
Keeping an eye on ROI isn’t a one-and-done task. It needs constant attention to ensure your investments continue delivering results. By maintaining ongoing monitoring, you can spot issues like performance dips, rising costs, or shifting business priorities that might impact returns.
Creating Tracking Dashboards
Dashboards are a key tool for linking process metrics (like model accuracy or training completion rates) to outcomes such as increased revenue or cost savings. Automating data collection is crucial - pulling real-time data from systems like your CRM or other essential tools ensures accuracy and timeliness.
"Without visibility into how content is being used, marketing can't evaluate which content reps prefer... Sales teams are also flying blind." – Highspot
The design of these dashboards should cater to different audiences. For example, C-suite executives might prioritize metrics like EBITDA impact, while managers on the ground are more interested in productivity stats. To meet these varying needs, include a mix of:
Financial metrics: Revenue growth, cost reduction, net present value
Operational metrics: Cycle time, error rates
Engagement metrics: Adoption rates, employee satisfaction
Tracking the Total Cost of Ownership is another critical element. This involves monitoring ongoing expenses like model retraining, cloud computing usage, and data governance costs to maintain a clear picture of ROI.
Adopting a portfolio approach can also enhance your perspective. Instead of looking at projects in isolation, evaluate how all AI initiatives collectively contribute to business goals. Companies that take this broader view have reported 40% higher returns compared to those focusing solely on cost-cutting.
With real-time dashboards in place, periodic reassessments ensure that your ROI aligns with the ever-changing needs of your business.
Periodic ROI Reassessment
Static ROI measurement doesn’t cut it. Schedule regular reviews - quarterly in the early stages and annually once processes stabilize. This approach helps capture the extended value that often unfolds 12–24 months after implementation.
For instance, between April 2024 and April 2025, the UK Cabinet Office saved or recovered $480 million by using AI-powered fraud detection tools across government programs.
"CFOs will soon be asked on earnings calls to articulate their AI strategy – and then, a few quarters later, to report, 'What was the ROI?'" – Gartner
Stage-gated reviews are useful for making decisions about scaling, pivoting, or shutting down specific projects. Keep an eye out for model drift - when AI accuracy declines over time - as this can undermine financial returns without obvious warning signs. Additionally, update your benchmarks regularly. Initial baselines often become outdated as your organization matures and achieves incremental improvements.
Interestingly, 42% of companies abandoned AI projects in 2025, largely because they struggled to demonstrate clear business value. Regular reassessments help ensure your systems evolve with changing conditions, keeping your investments relevant and worthwhile.
Conclusion
The methodologies and metrics outlined earlier provide a clear path for measuring ROI in AI enablement systems. This process is not just important - it’s essential. Success starts with defining clear business goals, setting pre-implementation baselines, and consistently tracking both financial and operational metrics. While it’s true that 95% of AI investments fail to show measurable returns, the root problem often lies in poor measurement practices rather than a lack of potential value.
To get it right, focus on three key steps:
Identify 3–5 key performance indicators (KPIs) that align directly with business outcomes like cost reduction or customer retention, rather than focusing solely on technical metrics.
Calculate the Total Cost of Ownership (TCO) thoroughly, factoring in hidden costs like maintenance or integration challenges alongside direct expenses.
Use real-time dashboards to link operational metrics to financial results, allowing you to spot and fix performance issues before they impact your returns.
Data backs up the value of this approach. For example, advanced AI initiatives meet or exceed ROI expectations 74% of the time, and top-performing companies credit these systems with over 10% of their operating profits. Consider the case of SA Power Networks: in September 2025, they achieved a 99% success rate in detecting corroding utility poles, saving $1 million annually through AI-driven infrastructure management. These outcomes are only possible with structured measurement and ongoing oversight.
ROI measurement doesn’t end after implementation - it’s a continuous process. During the initial rollout, schedule reviews every 3–6 months, then move to annual evaluations once the system stabilizes. Keep an eye out for model drift, monitor recurring costs, and make sure efficiency gains are reinvested into strategic, high-value tasks. After all, time saved is only valuable if it’s put to good use.
FAQs
What costs are often overlooked when calculating ROI?
Teams often miss hidden costs tied to implementation. These can include consulting fees, internal opportunity costs, system integration expenses, change management efforts, and the need for ongoing adjustments. Factoring in these elements is essential for calculating ROI accurately and understanding the true financial and operational impact.
How can we prove AI is driving revenue (not just correlation)?
To show that AI is boosting revenue, it's crucial to highlight clear connections between AI-driven efforts and financial results. Track metrics such as qualified leads, conversion rates, or revenue increases that can be directly tied to AI. Implement frameworks that monitor both leading indicators (like user engagement with AI tools) and lagging indicators (like overall revenue growth). Additionally, running controlled experiments or pilot programs with baseline data can help pinpoint how AI interventions contribute to revenue shifts.
What’s the best way to track ROI over time as usage and costs change?
To keep tabs on ROI as usage patterns and costs shift, set up a system for ongoing monitoring. Continuously revisit and update ROI metrics by recalculating payback periods, factoring in changes in user adoption, performance expectations, and any newly available data. This method helps ensure your ROI assessments stay precise and reflect the system's current and evolving impact.