

AI Enablement
Real-Time ROI Tracking for AI Projects
Real-time ROI tracking is transforming how businesses measure the success of their AI investments. Instead of waiting days for insights, companies can now monitor performance in milliseconds, enabling faster decisions and better outcomes. Here's what you need to know:
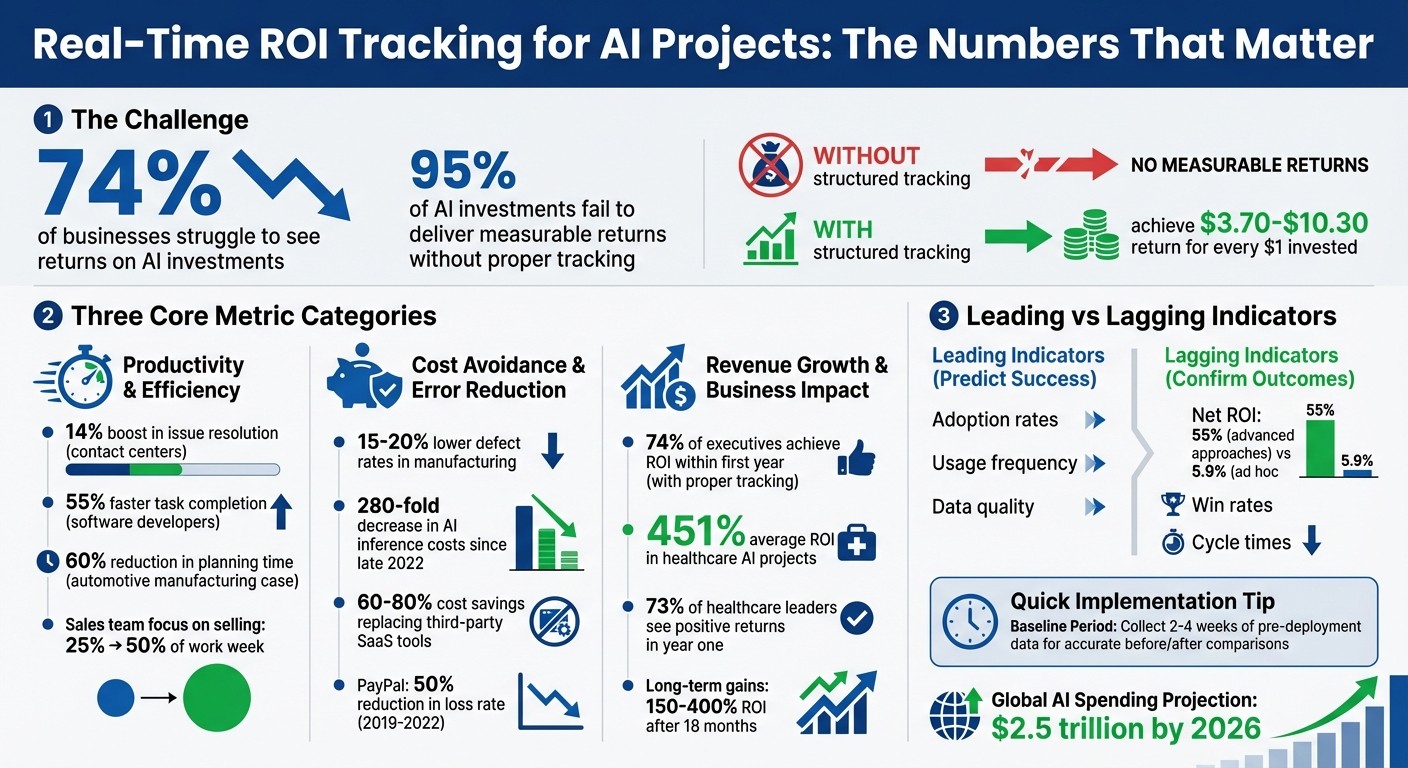
Why It Matters: 74% of businesses struggle to see returns on AI investments, often due to poor tracking. Real-time systems solve this by linking AI activity directly to measurable results like revenue, cost savings, and risk reduction.
Key Metrics: Focus on productivity (e.g., time saved), cost avoidance (e.g., error reduction), and revenue impact (e.g., customer retention). Leading indicators like adoption rates predict success, while lagging indicators confirm outcomes.
Examples: Companies like Walmart, PayPal, and Siemens have saved millions by using real-time tracking to improve accuracy, reduce downtime, and optimize operations.
Tools: Platforms like Power BI and Tableau help visualize data, while APIs and automated pipelines ensure seamless integration and monitoring.
Real-Time AI ROI Tracking: Key Metrics and Success Statistics
How to measure the ROI of AI using Asana’s 4-step framework
Key Metrics for Measuring AI ROI
To evaluate the success of AI investments, focus on three main metrics: productivity, cost avoidance, and revenue impact. Together, these metrics provide a well-rounded view of whether your AI efforts are delivering results.
It's important to distinguish between leading indicators - such as adoption rates, usage, and data quality - that predict success, and lagging indicators like net ROI, win rates, and cycle times, which confirm outcomes. Establishing a clear pre-AI baseline is critical for accurate comparisons. Organizations that track both types of metrics report ROI rates of 55% for advanced initiatives, compared to just 5.9% for those with ad hoc approaches. Before rolling out AI, gather 2–4 weeks of pre-deployment data to measure "before" and "after" performance effectively.
The financial potential of AI is clear: early adopters report returns averaging $3.70 for every $1 invested, with top performers achieving up to $10.30. However, 74% of companies still struggle to see value, often due to tracking the wrong metrics or skipping baseline measurements.
Productivity and Efficiency Metrics
To measure productivity gains, calculate:
(time saved per task) × (monthly task count) × (fully loaded hourly wage).
For example, in 2025, a Michigan-based automotive parts manufacturer implemented AI for production planning. This reduced planning time by 60%, from 8–10 hours to just 3.2 hours per day. Over six months, the system uncovered $2.3 million in cost-saving opportunities and improved on-time delivery rates from 78% to 94%. This demonstrates how time savings can directly lead to operational and financial improvements.
Efficiency gains, which reflect output per unit of time, can be measured by comparing tasks completed per hour before and after AI deployment. For instance, AI assistants have been shown to boost issue resolution rates by 14% for contact center agents and speed up task completion by 55% for software developers.
Another key metric is team utilization, which tracks the shift in employee focus from repetitive tasks to strategic work. This can be calculated as:
(Time spent on high-value tasks ÷ Total work time) × 100.
For example, AI can double the time sales teams spend on selling activities, increasing it from 25% to over 50% of their work week. Additionally, experience compression allows less experienced employees to perform at levels comparable to seasoned professionals, optimizing workforce efficiency. This can be measured by comparing skill requirements and wage differences before and after AI implementation.
Cost Avoidance and Error Reduction
Cost avoidance metrics focus on expenses that AI prevents. These include reduced handle times, saved labor hours, avoidance of late fees, vendor tool consolidation, and risk mitigation. Risk mitigation, for example, can be calculated as:
(Cost of a bad outcome × Probability AI prevents it).
A real-world example is PayPal, which used AI-driven cybersecurity to halve its loss rate between 2019 and 2022 while nearly doubling its payment volume. In Q2 2023, PayPal reported an 11% reduction in losses due to enhanced AI models.
Error reduction is another critical area. For generative AI, track hallucination rates - instances where the AI produces incorrect or nonsensical outputs. For classification and prediction systems, use F1-scores to balance precision and recall. Operationally, monitor exception rates (human intervention frequency), touchless processing rates (transactions completed without manual review), rework time, and compliance flags.
In manufacturing, AI-powered quality control has been shown to lower defect rates by 15–20%. However, faster processes can lead to errors if quality isn’t monitored. Pair productivity metrics with quality checks, such as customer satisfaction scores or error rates, to ensure speed doesn’t come at the cost of accuracy. Calculate "Real AI ROI" by subtracting the cost of human intervention for fixing AI errors from your total productivity gains.
AI also offers cost savings by replacing third-party SaaS tools with in-house systems, potentially cutting costs by 60–80%. Additionally, AI inference costs have plummeted 280-fold since late 2022, making large-scale automation more affordable. Track metrics like cost per inference or transaction to ensure these savings are realized.
Revenue Growth and Business Impact
Revenue growth metrics connect AI performance to financial outcomes. These include conversion rate improvements, revenue per user, pipeline velocity, average deal size, win rates, and customer retention rates. These indicators resonate with executives focused on business performance.
"Activity-based measures like 'productivity gains' or 'time saved' don't translate to boardroom language. Executives need to see direct financial impact through metrics they already track."
Nate Suda, Executive Editor, Gartner
AI can also speed up decision-making, shorten sales cycles, and improve onboarding processes (motion metrics). Financially, it boosts deal sizes, win rates, and customer lifetime value (money metrics). To justify investments, use scenario analysis to model risk-adjusted ROI, accounting for the cost of inaction. While initial phases may show negative returns (a "J-curve" effect), long-term gains can reach 150–400% after 18 months.
Randomized A/B testing is a powerful tool for proving AI’s value. By comparing outcomes between control and treatment groups, you can isolate AI's impact and provide stakeholders with clear, defensible evidence.
Tools and Systems for Real-Time ROI Tracking
To track ROI effectively, businesses need systems that bring together data from multiple sources, automate calculations, and flag performance changes as they happen. The goal is a unified, constantly updated view that connects AI usage logs, financial metrics, and productivity data. Below are some tools and approaches that show how real-time data integration and visualization can improve ROI monitoring.
Data Visualization and Dashboard Tools
For enterprises, Power BI and Tableau are standout options. Power BI starts at $10.00 per user per month for Pro licenses. It works seamlessly with Microsoft Graph API, allowing businesses to track AI usage alongside productivity metrics. Its DAX engine can handle calculations like "Total Hours Saved" and "Cost Per Hour Saved." Tableau, priced between $15.00 and $75.00 per user monthly, focuses on visual storytelling and includes Einstein Discovery for spotting anomalies.
Smaller teams might find Zoho Analytics a better fit, starting at $24.00 per month for two users. It features a natural language assistant, which lets users ask simple questions like, "Which department saved the most time last month?" without needing technical expertise.
In May 2025, Microsoft's sales team used Copilot Analytics dashboards to analyze how AI usage affected business outcomes. They found that sellers with high AI adoption achieved 9.4% higher revenue and closed 20% more deals. Mike Walsh, Microsoft's Director of Product Marketing, explained:
"The challenge now is understanding AI's real impact. That's where Copilot Analytics steps in - offering tools to track adoption, productivity shifts, and most importantly, business outcomes."
But visualization alone isn't enough - seamless data integration is key for effective ROI tracking.
Integration with AI Platforms
Modern ROI tracking systems depend on APIs to stream real-time data. Tools like Microsoft Graph API, GitLab GraphQL, and Snowflake ensure that data flows continuously from usage logs to business metrics. This integration allows organizations to monitor both current activity and long-term trends.
For example, in September 2025, a financial services firm partnered with GitLab through the Duo Accelerator program. They implemented Python scripts and CI/CD pipelines to automate data collection. The results? Active users delivered a 127% monthly ROI through time savings, but 23% of AI licenses were underused. This insight allowed the company to optimize its license allocation immediately.
To ensure data security, implement row-level security and role-based access controls. Executives can focus on overall ROI trends, while department managers see team-level productivity data. Tools like Power BI help restrict access to sensitive financial information, ensuring that only authorized personnel can view it.
Performance Alerts and Review Mechanisms
Static dashboards are useful, but they can’t predict problems. Automated alerts fill this gap, notifying teams when ROI metrics fall outside acceptable ranges. For example, alerts can flag sudden drops in adoption rates, spikes in cost per inference, or rising error rates that hurt productivity.
Streaming architectures, such as Azure Event Hubs or Power BI streaming datasets, make it possible to track AI consumption in real time. These systems handle high volumes of data, providing immediate feedback on usage patterns. Microsoft’s move to "Pay As You Go" pricing for AI agents highlights the importance of real-time cost monitoring to manage fluctuating expenses.
To maintain performance, set regular review checkpoints with clear "kill criteria" for underperforming projects. If a pilot program fails to show measurable ROI within a set timeframe, it may be time to pause or rework the initiative. This approach also helps combat benefits decay, where model drift or outdated data reduces AI effectiveness over time. These alert systems ensure continuous improvement and alignment with business goals.
Case Studies: Real-Time ROI Tracking Across Industries
These examples highlight how continuous monitoring can deliver measurable returns right from the start.
Manufacturing: Predictive Maintenance Success
In November 2025, Precision Components Inc., a leading automotive parts manufacturer, introduced IoT sensors to track vibration and thermal patterns across critical machinery. Spearheaded by Operations Manager Sarah Martinez, the project led to a 25% drop in unplanned downtime and a 15% cut in maintenance costs, resulting in $180,000 in yearly savings. The company achieved ROI in just 8 months.
The system transformed their approach from reactive to condition-based maintenance. By flagging potential issues days in advance, repairs could be scheduled during planned downtime, avoiding costly emergency fixes. Emergency repairs, after all, can cost 3 to 5 times more than planned maintenance.
"Our 55-year-old maintenance supervisor became our biggest AI advocate once he saw how it made his job easier, not harder." - Sarah Martinez, Operations Manager, Precision Components Inc.
On a larger scale, Siemens implemented its MindSphere AI-IoT platform across 41 manufacturing plants, connecting 1.3 million devices. The platform’s real-time fault detection system predicted failures weeks in advance, delivering ROI in under 3 months. For mid-sized facilities with around 50 machines, initial investments typically range between $75,000 and $150,000, with annual licensing costs of $48,000 to $96,000.
Healthcare: Improved Patient Outcomes
In healthcare, real-time tracking doesn’t just save money - it saves lives. Tampa General Hospital adopted Palantir AI for sepsis monitoring and care coordination, detecting sepsis earlier and saving over 700 lives. Beyond that, the system reduced patients' length of stay, showcasing how clinical improvements can drive financial returns.
Johns Hopkins Hospital used predictive models for readmission risks between 2024 and 2025, analyzing lab results and social factors in real time. This initiative reduced 30-day readmissions by 20%, saving $4 million annually.
Meanwhile, Seattle Children's piloted Abridge ambient AI for 90 days in 2025. With 58 users across 15 divisions, the project, led by Dr. Zafar Chaudry, reduced time spent on note-taking by 15.5% and cut documentation effort by 77%. Physicians quickly saw the benefits, which built trust and encouraged adoption. On average, healthcare AI projects report an ROI of 451%, with 73% of healthcare leaders experiencing positive returns within the first year.
Sales and Customer Service: Revenue Growth
Real-time tracking is also a game-changer in sales and customer service. Between February and May 2025, Salesforce’s internal "Customer Zero" team used Salesforce Data Cloud and Agentforce Sales Coach to offer 24,000 personalized recommendations to their sellers. Led by Ali Nahvi and Laura Skelly, the project generated $37 million in pipeline and closed ACV within four months.
The system’s AI recommendations had a 38% action completion rate, far surpassing the 8% baseline of traditional dashboard-based tools. Instead of static reports, sellers received immediate, actionable advice - like which accounts to target and what messaging to use.
"By moving from passive dashboards to active agents, we didn't just predict success, we helped secure it." - Ali Nahvi, Director of Product Innovation, Salesforce
Smaller businesses also saw big returns. A B2B SaaS startup with just 8 employees implemented AI-driven lead scoring and automated email sequences over 12 months, boosting lead conversion rates from 3.2% to 5.8% and shortening sales cycles from 45 to 32 days. The result: an additional $580,000 ARR and a 2,662% ROI.
In another instance, a mid-sized fashion e-commerce company deployed a ChatGPT-powered chatbot for 6 months. The chatbot reduced human-led support tickets by 40% and raised customer satisfaction from 4.2 to 4.7/5, saving $48,000 annually and delivering a 400% ROI.
How to Implement Real-Time ROI Tracking
Establishing a Baseline and Defining KPIs
Start by gathering 2–4 weeks of pre-rollout data to establish a baseline. This baseline acts as your control group, helping you clearly see whether improvements come from AI or external factors like seasonal changes. Without this context, it’s tough to make informed decisions.
Next, set specific, measurable KPIs. For example, you might aim to reduce support handle time by 12% or cut supply chain stockouts by 20%. Then, translate these goals into dollar values. If AI saves 10 hours per week, and your fully loaded labor cost is $45.00 per hour, that’s roughly $23,400.00 in annual savings.
Don’t stop at efficiency metrics - pair them with quality checks. If you’re speeding up processes, also track indicators like customer satisfaction or error rates to ensure quality isn’t sacrificed. A three-tier framework can help:
Tier 1: Basic usage metrics (e.g., active users, session frequency)
Tier 2: Workflow efficiency (e.g., time saved, error reduction)
Tier 3: Business impact (e.g., revenue growth, cost savings)
With KPIs defined and a baseline in place, the next step is automating data collection to keep everything running smoothly.
Setting Up Monitoring Systems
Integrate your tracking tools directly with AI platform APIs - like GitLab's GraphQL API or Microsoft Graph API - to automatically pull real-time usage data. Use CI/CD tools and Python scripts to build automated data pipelines for collecting, processing, and displaying metrics, eliminating the need for manual updates. For instance, a tailored GitLab integration once revealed underutilized licenses, allowing for immediate reallocation.
Create dashboards tailored to your audience. Executives need high-level summaries of ROI, while project teams benefit from detailed metrics like cost-per-task or model accuracy. Add FinOps widgets to track AI consumption costs in real time, ensuring expenses don’t outpace the value generated. Automate updates weekly or monthly to keep dashboards current and trigger alerts for deviations.
These systems provide the foundation for ongoing reviews and agile adjustments.
Continuous Improvement Through Feedback Loops
Once baselines and dashboards are in place, continuous feedback ensures AI performance stays on track. Schedule weekly pilot standups, monthly finance reviews, and quarterly portfolio assessments to monitor ROI progress. If a pilot doesn’t hit its Minimum Detectable Effect after two iterations, it’s time to pause or pivot. As Andy Wang from Skywork AI notes:
"The courage to stop is a hallmark of high-ROI portfolios".
AI performance is not static - models drift, business conditions change, and assumptions need regular updates. Reassess your metrics after major process changes or model updates. Also, track how saved hours are being used - time savings only create value when redirected to high-impact tasks. Segment data by team or department to pinpoint adoption gaps and focus training efforts where ROI lags.
For companies that follow this disciplined approach, the results are clear. Studies show AI can boost productivity by 14% for contact center agents and speed up task completion by 55% for software developers. However, it’s worth noting that 95% of AI investments fail to deliver measurable returns - not because AI lacks value, but because companies often fail to properly track it.
To ensure your AI projects deliver results, explore the data-driven enablement systems offered by Rebel Force.
Conclusion
Tracking ROI in real time transforms experimental AI initiatives into measurable successes. Data shows that 74% of executives achieve ROI from generative AI within the first year when outcomes are tracked effectively. On the flip side, 95% of companies without proper tracking see no measurable impact on their bottom line. Structured approaches yield impressive returns, with organizations reporting gains of $3.70 to $10.30 for every dollar invested.
This highlights the importance of refining how we measure success. As David Gallacher from UC Berkeley aptly puts it:
"We're not experiencing an AI failure; we're experiencing a measurement failure. It's time to evolve our metrics to match the transformation we are truly experiencing."
In today’s landscape, investment decisions hinge on clear, quantifiable outcomes. With global AI spending projected to hit $2.5 trillion by 2026, CFOs and CEOs demand hard evidence that these investments drive real results. Real-time tracking offers that evidence, empowering leaders to make swift, informed adjustments - just as demonstrated in earlier case studies.
To thrive in this AI-driven era, businesses need a comprehensive ROI system. This means accounting for every aspect of the investment - data preparation, integration, change management - and strategically reallocating saved resources to higher-value tasks. Companies that embrace this approach don’t just adapt to AI; they position themselves as leaders in the transformation.
For organizations ready to embrace data-driven decision-making, Rebel Force offers expertise in diagnosing challenges, crafting custom solutions, and delivering measurable ROI.
FAQs
How do I set a solid ROI baseline before deploying AI?
To build a reliable ROI baseline, begin by pinpointing measurable metrics such as time, cost, revenue, or error rates that represent your current performance. Break down existing expenses, estimate how AI could improve these areas, and weigh those improvements against the costs of implementation. This approach provides a solid foundation to assess how effective AI is after it’s up and running. Make sure the metrics you choose align closely with your specific objectives for a more precise evaluation.
What are the best early indicators of AI ROI?
When evaluating the return on investment (ROI) from AI, it's important to focus on early indicators like AI readiness and enablement, user engagement with AI tools, and workflow time saved. These indicators provide a snapshot of how well AI is being integrated into your business processes.
You can measure these factors through metrics such as action counts and user activity. For example, tracking how often employees interact with AI tools or how much time is being saved in daily workflows can give you a clear picture of progress. Keeping an eye on these metrics helps businesses gauge the success of their AI initiatives early on, ensuring they’re on track to deliver meaningful results.
How do I include AI errors and human rework in ROI?
To factor AI errors and human rework into ROI calculations, start by assessing the cost of errors avoided and the time saved from reduced rework. Break it down like this:
Identify the expenses tied to errors that AI helps prevent.
Measure the amount of time saved by reducing the need for manual corrections.
Multiply the time saved by your fully-loaded labor costs (which include wages, benefits, and overhead).
This method provides a clearer picture of AI's effect by capturing both the direct cost savings and the indirect gains in operational efficiency.