
AI Enablement
AI ROI Attribution: Key Metrics to Track
Measuring the ROI of AI projects is challenging but crucial for businesses to validate their investments. AI's value often comes from process improvements and cost savings, but tracking these benefits requires the right metrics and frameworks. Here's a quick breakdown:
Financial Metrics: Focus on Net Present Value (NPV), Internal Rate of Return (IRR), and Payback Period. For example, AI-driven campaigns have delivered ROI as high as 1,954%.
Efficiency Metrics: Time savings, error reduction, and process cycle improvements are key. Green Thumb Landscaping saved $7,020 annually by reducing scheduling time by 75%.
Customer Impact: Metrics like Net Promoter Score (NPS) and retention rates help gauge AI's effect on customer experience.
Challenges: Scaling AI often leads to higher costs, with ROI dropping from 31% in pilot phases to 7% at scale due to expensive implementation and poor metric alignment.
Rebel Force addresses these hurdles with a 4-phase process: Diagnose, Design, Execute, and Validate. Their approach links AI metrics to measurable business outcomes, aiming for a 3:1 ROI benchmark. While traditional ROI models focus on financial clarity, Rebel Force emphasizes tracking human and process adjustments to ensure AI delivers real value.
Key Takeaway: Define success upfront, track metrics over 8–12 weeks, and reinvest saved capacity into revenue-generating activities. Without proper planning, up to 95% of AI investments fail to show measurable returns.
Measuring AI Success: Beyond Technical Metrics
1. Standard ROI Metrics
Measuring the return on investment (ROI) for AI projects requires a mix of financial, operational, and customer-focused metrics. Unlike traditional IT projects, AI initiatives tend to deliver value gradually, with improvements compounding over time as the models evolve and adoption grows. To get an accurate picture, it’s essential to understand which metrics matter and how they differ from conventional ROI approaches.
Financial ROI Metrics
The financial side of AI ROI starts with four key metrics: Net Present Value (NPV), Internal Rate of Return (IRR), Payback Period, and Cost Avoidance. These metrics help determine whether an AI project generates positive cash flow and how quickly it pays off. AI projects often have longer payback periods - typically 12 to 24 months or more - compared to the 7 to 12 months seen with traditional IT investments. When calculating multi-year NPV, it’s important to account for risks related to adoption and performance fluctuations using adjusted discount rates.
Other crucial metrics include Revenue Uplift and Cost per Transaction, which provide insight into growth and operational efficiency. A great example is Jordan Craig Apparel, which used AI-driven personalized email campaigns over a year. This effort led to a 54% increase in email revenue, adding approximately $380,000 in incremental revenue. With implementation costs of $18,500, the initiative delivered a staggering 1,954% ROI. This demonstrates how revenue-focused metrics can directly highlight AI's contribution to business growth.
AI costs are often variable, such as token usage or API fees, unlike fixed licensing fees. Monitoring unit economics - like cost-per-output - is critical. For instance, AI support tickets might range from $0.12 to $0.40 per ticket, and ensuring these costs don’t outweigh the benefits is key.
Operational Efficiency Metrics
Operational metrics focus on how AI creates value. Key indicators include Time Savings per Employee, Process Cycle Time Reduction, Automation Rate, and Error Rate Reduction. These metrics reveal where AI excels and where human oversight is still needed.
Take Green Thumb Landscaping, for example. Their AI scheduling assistant reduced manual scheduling time from four hours to one hour per week. Over a year, this saved 156 hours, valued at $7,020, against AI costs of $588 - resulting in a 123% ROI.
When calculating time savings, it’s important to apply a realization rate of 50–60%, as not all saved time translates directly into productive work. The formula is simple: (Time saved per task × tasks per period × hourly rate). Similarly, error reduction can be quantified as (change in error rate × cost per error × volume).
To isolate AI’s impact, use A/B testing and establish a controlled baseline over 6–8 weeks.
Customer Impact Metrics
Metrics like Net Promoter Score (NPS), Customer Satisfaction (CSAT), customer retention rates, and conversion rate uplift can help determine whether AI-driven improvements translate into better customer experiences.
However, attributing these benefits can be tricky. AI often enhances many small tasks rather than delivering obvious, standalone results. As the Controllers Council explains:
"Most organizations report localized business impact rather than enterprise-wide transformation. This requires more granular ROI measurement approaches focused on operational metrics".
By combining these metrics, businesses can create a more complete picture of AI's value.
Composite Attribution Frameworks
Frameworks like Total Economic Impact (TEI) and Balanced Scorecards expand the scope of ROI measurement. They include factors like flexibility, risk reduction, and indirect benefits alongside financial returns. The AI ROI Performance Index, for example, integrates metrics like Time Savings, Error Reduction, Capacity Expansion, Revenue Acceleration, and Quality/Consistency.
To better measure ROI, many organizations are turning to Causal AI with Incrementality Testing. This involves maintaining a "Universal Holdout Group" (typically 10% of users) that doesn’t experience AI interventions, enabling a clearer assessment of AI’s impact on metrics like Lifetime Value (LTV). The Triangulation Method further strengthens this approach by combining platform-reported data, Marketing Mix Modeling for strategic insights, and Incrementality Testing as the baseline.
Interestingly, companies leading in AI ROI are 86% more likely to use different frameworks or timelines for generative AI versus agentic AI. As Keerok’s AI Implementation Framework notes:
"AI ROI measurement must extend beyond simple cost savings to encompass the full spectrum of value creation, including product innovation, market positioning, and sustainable competitive advantage".
2. Rebel Force's 4-Phase Enablement Process

Rebel Force breaks down AI ROI attribution into four clear phases: Diagnose, Design, Execute, and Validate. Each phase builds on the last, ensuring that all key metrics are integrated and directly linked to measurable results. The goal? A 3:1 ROI benchmark - every dollar invested should ideally generate $3.00 in measurable business value within 12 months.
Financial ROI Metrics
In the Validate phase, ROI is tracked separately for Year 1 and Year 2. A payback period of 6 months is considered excellent, while a timeframe of 6–12 months indicates good performance. This phased approach helps organisations set realistic expectations from the Diagnose phase through to Execute and Validate. Operational metrics are then refined to further confirm AI's contributions to efficiency.
Operational Efficiency Metrics
Rebel Force's framework also focuses on operational efficiency, using a three-tiered metrics approach. Adoption rates, content usage, and self-service engagement are closely monitored during the Execute phase. This helps fine-tune strategies and ensures AI solutions are having the desired impact.
Customer Impact Metrics
A key part of Rebel Force's process is establishing a 3–6 month baseline during the Diagnose phase. This not only builds credibility with executives but also sets the stage for tracking early indicators like customer self-service adoption. These metrics can predict outcomes such as revenue protection and customer retention. By focusing on these customer impact metrics during the Execute phase, organisations can stay on track to meet the 3:1 ROI benchmark.
Pros and Cons
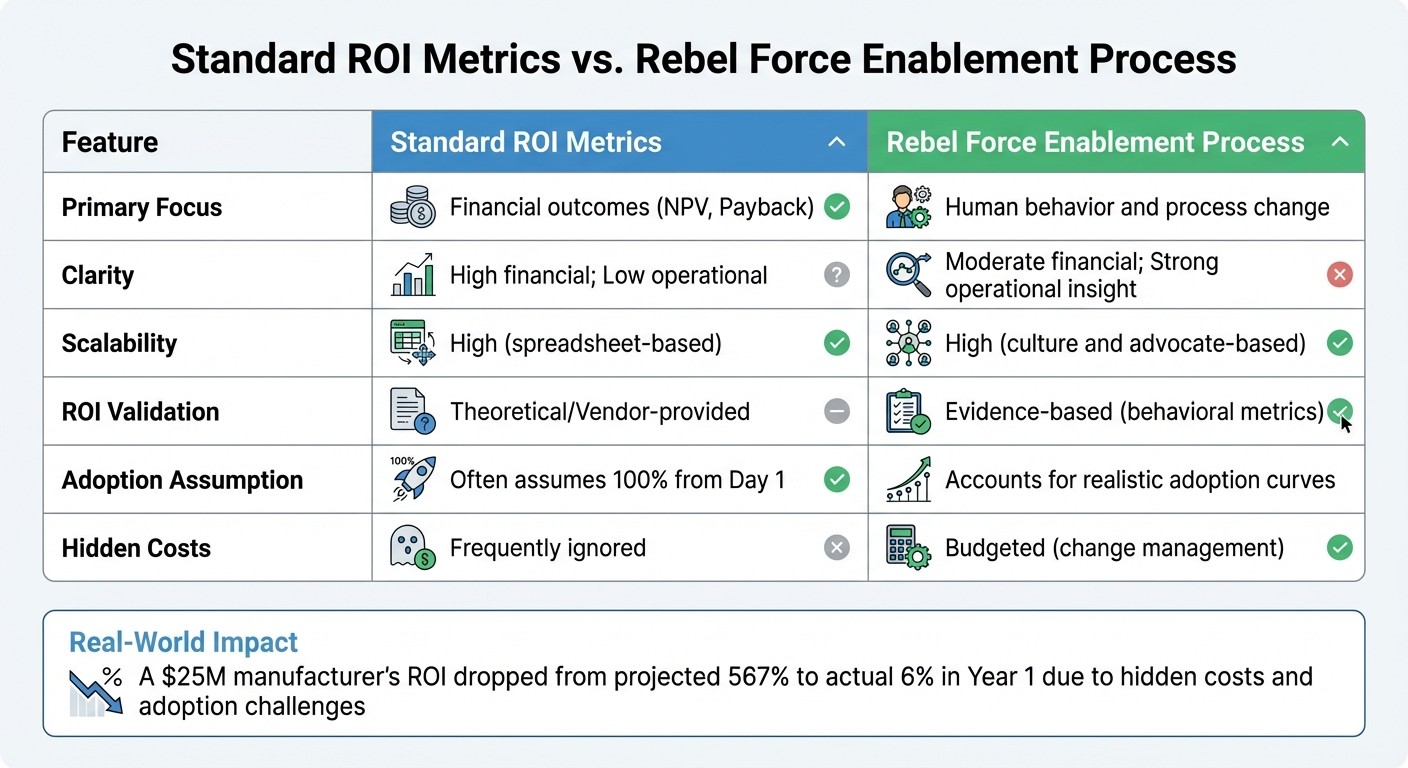
Standard ROI Metrics vs Rebel Force Enablement Process Comparison
Standard ROI metrics and Rebel Force’s structured process each bring distinct strengths and weaknesses to the table. Let’s break them down.
Standard ROI metrics excel in delivering financial clarity. Tools like Net Present Value (NPV) and payback period calculations are straightforward, making them easy to apply across projects using spreadsheets. However, these metrics often fail to account for redeployment risks tied to saved capacity. Without clear strategies to turn time savings into revenue, the financial picture can quickly shift. For instance, a $25 million-revenue manufacturer initially projected a 567% ROI based on $60,000 in costs and $400,000 in savings. But after factoring in $140,000 in hidden change management costs and a 50% adoption rate, the Year 1 ROI plummeted to just 6%.
On the other hand, Rebel Force’s 4-phase enablement process takes a more holistic approach, focusing on human behavior and process adjustments rather than theoretical savings. This method includes budgeting for change management and tracking realistic adoption rates, avoiding the assumption that new technology will achieve 100% usage from day one. While financial clarity may appear moderate during early stages, the process ensures operational insight through its Diagnose, Design, Execute, and Validate phases. Research highlights that adoption alone isn’t enough - technology must deliver tangible user value to succeed.
Here’s a side-by-side comparison of their key features:
However, standard ROI metrics often falter as AI projects scale. Early pilots in 2023 showed 31% returns, but by 2025, ROI dropped to just 7%, often falling below the cost of capital. Additionally, it’s estimated that 72% of enterprise AI investments result in wasted resources due to poor accountability frameworks. Rebel Force’s approach tackles these pitfalls by emphasizing AI fluency and creating interoperable systems, ensuring that saved capacity translates into revenue-generating activities.
Both methods have their place, but Rebel Force’s enablement process offers a more grounded and sustainable route to long-term value. It pushes decision-makers to prioritize evidence-based evaluations over overly optimistic vendor projections.
Conclusion
Choose AI ROI metrics that align with your organization's goals, budget, and level of readiness. For smaller businesses aiming for fast results, operational metrics like time savings and error reduction can be key. For instance, Green Thumb Landscaping reduced scheduling time by 75%, achieving a 123% ROI within a year. Larger enterprises with a longer-term focus might benefit more from financial models like Net Present Value (NPV) or Internal Rate of Return (IRR), which factor in the time value of money and risk. These methods, however, require a solid baseline to deliver actionable insights.
Establishing an accurate baseline is critical for measuring ROI effectively. Start by documenting KPIs for 8–12 weeks before implementing AI solutions. Without this, any improvements may seem anecdotal rather than backed by data. It's worth noting that 95% of AI investments fail to show measurable returns, often because organizations neglect to define success criteria upfront.
"The most relevant KPIs are those that align technical AI metrics with strategic business objectives. A technically excellent AI solution without measurable business impact creates no real value." - Keerok AI
Avoid focusing solely on headcount reduction as a measure of success. Instead, monitor capacity released and identify specific ways to reinvest saved time - such as boosting proposal output by 20% or enhancing customer engagement. Also, include a 40–60% cost buffer in your initial estimates to cover hidden expenses like data cleanup or change management. This strategic preparation lays the groundwork for a meaningful and measurable ROI evaluation.
FAQs
What are the top 3–5 KPIs to track for AI ROI?
To gauge the success of AI projects, you should keep an eye on cost savings, revenue growth, and productivity improvements. These metrics are widely regarded as crucial for assessing the impact of AI initiatives. By concentrating on these areas, you can effectively measure the results and confirm the value your AI investments bring.
How do I set a baseline to prove AI impact?
To gauge the impact of AI effectively, start by setting clear goals and identifying key performance indicators (KPIs) for your projects. Begin by assessing your current performance - whether that's operational metrics, financial outcomes, or other relevant benchmarks - before implementing AI. This initial data serves as your baseline. Once AI is in place, compare the new results against this baseline to pinpoint improvements, such as increased revenue, reduced costs, or enhanced efficiency, that stem directly from your AI initiatives.
How do I account for hidden AI costs and adoption?
To truly understand the expenses tied to AI, you need to look beyond just licensing fees. There are additional costs to factor in, such as consulting services, integration efforts, employee training, and continuous system adjustments. Implementing AI isn't an overnight process - it often takes months before it reaches peak efficiency.
To make sure you're getting a return on your investment, monitor key metrics like time saved, improvements in productivity, and overall cost reductions. It's also crucial to budget wisely, not just for the initial setup but for the ongoing costs of maintaining and optimizing the system. This will help you avoid underestimating the full financial commitment.